![[attach.png]](idldoc-resources/xattach.png.pagespeed.ic.tvtntcUO-o.png)
./
pp_sphericalpath.pro
Routines
top source pp_sphericalpath
result = pp_sphericalpath(lons, lats [, maxlength=maxlength] [, nsegments=nsegments] [, open=open] [, _ref_extra=_ref_extra], no_fix_lon=no_fix_lon)
Given a set of lon/lat points on a sphere, this function calculates vertices of a path connecting the input vertices, placed along great circles connecting the input vertices. The path is a polygon approximation of the curved path formed by the great circles.
Return value
A 2D array [2,N] with a set of longitudes/latitudes for the N vertices of the path, for each path.
The number of vertices along each edge is determined by maxlength
or nsegments. If open is set, the last point is not connected to the first point.
If multiple polygons were given as input, the ouput is a list, where each list element is a [2,N] array
with lon/lat for each polygon (N needs not to be the same for all polygons).
Parameters
- lons in required
An array of longitudes for the vertices which are to be connected by a path made of great circles. Must be in degrees, unless
radiansis set. Multiple polygons are supported in two different ways: 1) If all N polygons have the same number of vertices (M), lons can be given as a [M,N] array. 2) For arbitrary numbers of vertices, lons is given as a list, where each list element is an array of vertices for one polygon. With multiple polygons, the ouput is a list, where each list element has latitudes and longitudes for one polygon.- lats in required
An array of latitudes for the vertices which are to be connected by a path made of great circles. Must be in degrees, unless
radiansis set. Multiple polygons are supported in two different ways: 1) If all N polygons have the same number of vertices (M), lats can be given as a [M,N] array. 2) For arbitrary numbers of vertices, lats is given as a list, where each list element is an array of vertices for one polygon. With multiple polygons, the ouput is a list, where each list element has latitudes and longitudes for one polygon.
Keywords
- maxlength in optional default=0.1
If set, specifies the maximum angular length of each segment of the polygon.
- nsegments in optional
If set, specifies a fixed number of vertices to use in for the line connecting each pair of input points. If both
maxlengthandnsegmentsare set,nsegmentstakes precendence.- open in optional default=0
If set, the output path does not connect the last input point to the first input point.
- _ref_extra in out optional
Anything else is passed along to map_2points, which is used to create the paths connecting the pairs of input points. One commonly used option would be the radians keyword, to use radians, instead of degrees, for
lonandlat. See the IDL help for map_2points' options.- no_fix_lon
Examples
Create a rectangle in lon/lat:
 lons=[30d0,120d0,120d0,30d0]
lats=[70d0,70d0,10d0,10d0] path=pp_sphericalpath(lons,lats) file = FILEPATH('avhrr.png', SUBDIRECTORY=['examples','data'])
data = READ_PNG(file, r, g, b)
IMAP, data, LIMIT=[-90,-180,90,180], $
MAP_PROJECTION='Mollweide', RGB_TABLE=[[r],[g],[b]], $
IMAGE_TRANSPARENCY=50, GRID_UNITS=2, $
IMAGE_LOCATION=[-180,-90], IMAGE_DIMENSIONS=[360,180] iplot,lons[[0,1,2,3,0]],lats[[0,1,2,3,0]],color='red',/overplot iplot,/overplot,color='green',path,thick=3.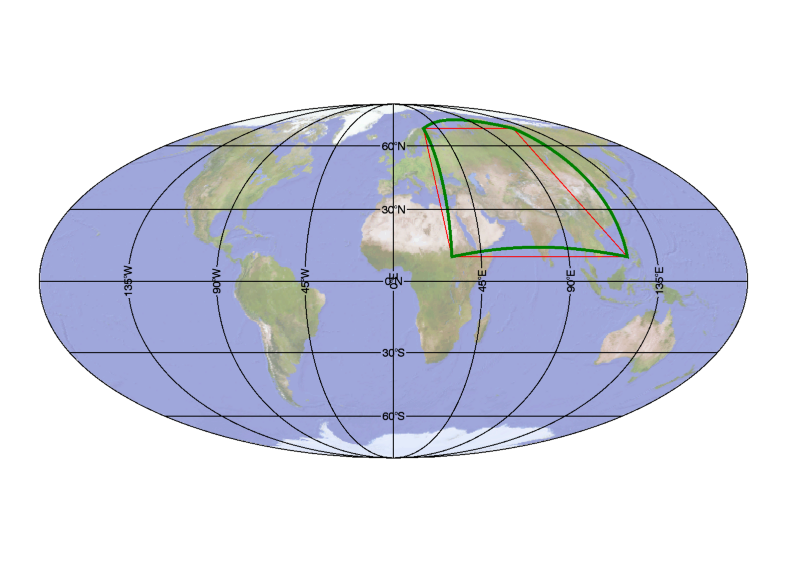
The green path, produced with the output of pp_sphericalpath looks
like a curve, made by the 4 great circles connecting these points. In reality,
the path is made of 2367 points, separated by 0.1 degrees.
This can be verified by making the same plot on a gnomonic projection, which has
the property that great circles are straight lines:
 imap,data,limit=[0,20,80,130],map_projection='mollweide',rgb_table=[[r],[g],[b]],$
 grid_units=2,image_transparency=50,image_location=[-180,-90],$
 image_dimensions=[360,180],center_latitude=50,center_longitude=75
 iplot,/overplot,color='green',path,thick=3.
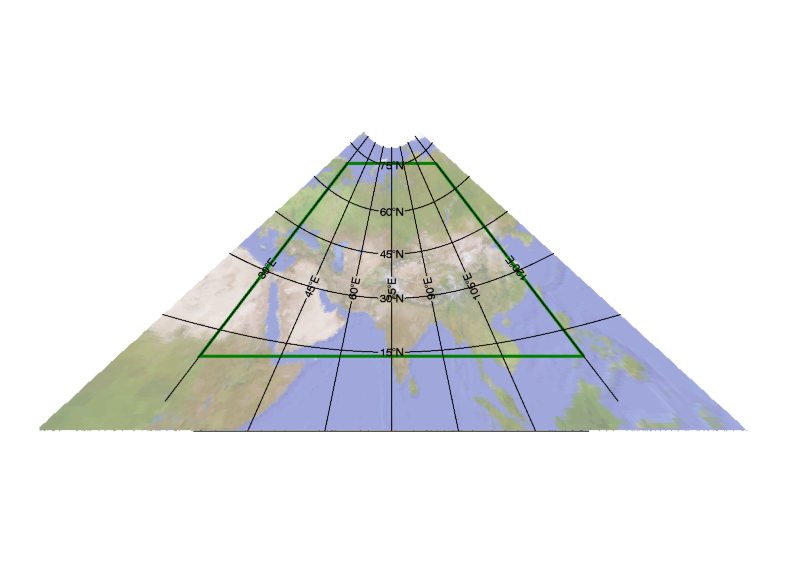
Where the green path is rendered as straight lines, since great circles map into straight lines in a gnomonic projection.
Author information
- Author:
Paulo Penteado (http://www.ppenteado.net), Nov/2014
Statistics
| Lines: | 63 lines |
| Cyclomatic complexity: | 21 |
| Modified cyclomatic complexity: | 21 |
File attributes
| Modification date: | Wed Mar 7 17:08:26 2018 |
| Lines: | 63 |
| Docformat: | rst rst |