![[attach.png]](idldoc-resources/xattach.png.pagespeed.ic.tvtntcUO-o.png)
./
pp_histogramlines.pro
Routines
top source pp_histogramlines
pp_histogramlines, locations, histogram_counts, x=x, y=y
Makes x and y coordinates to make a histogram plot that looks the usual way, with lines connecting the histogram counts to y=0 at each side of each bin.
Parameters
- locations in required
The coordinate of the start of each bin (like what is returned by IDL's histogram(). See example below.
- histogram_counts in required
The count for each bin. See example below.
Keywords
- x out required
The x coordinate to use in the plot. See example below.
- y out required
The y coordinate to use in the plot. See example below.
Examples
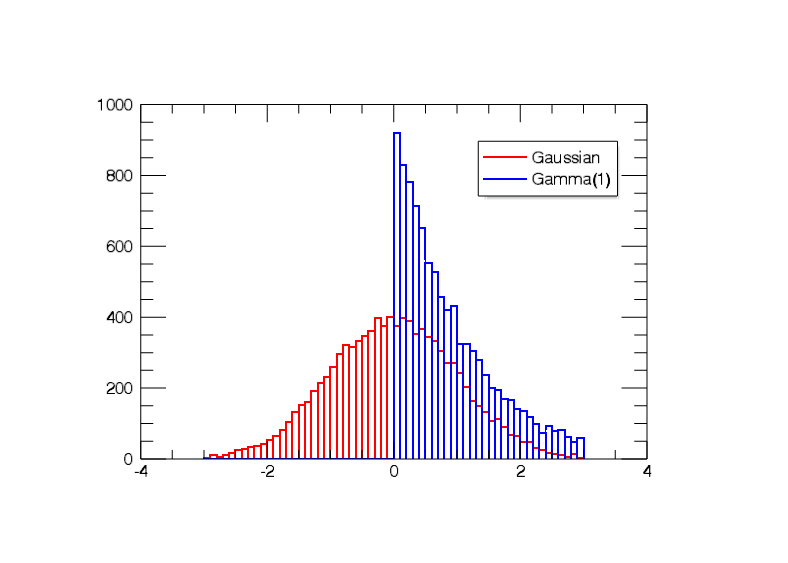
Create an array with 10000 Gaussian-distributed doubles and plot a histogram:
 values=randomu(seed,10000,/normal,/double)
 hist=histogram(values,min=-3d0,max=3d0,binsize=0.1,locations=loc)
 pp_histogramlines,loc,hist,x=x,y=y
 iplot,x,y,color='red',name='Gaussian',insert_legend=[0.3,0.5],thick=2.
 values=randomu(seed,10000,gamma=1d0,/double)
 hist=histogram(values,min=-3d0,max=3d0,binsize=0.1,locations=loc)
 pp_histogramlines,loc,hist,x=x,y=y
 iplot,x,y,color='blue',name='Gamma(1)',/insert_legend,/over,thick=2.
Author information
- Author:
Paulo Penteado (pp.penteado@gmail.com), Jan/2013
Statistics
| Lines: | 13 lines |
| Cyclomatic complexity: | 1 |
| Modified cyclomatic complexity: | 1 |
File attributes
| Modification date: | Wed Jun 29 22:15:28 2016 |
| Lines: | 13 |
| Docformat: | rst rst |