![[attach.png]](idldoc-resources/xattach.png.pagespeed.ic.tvtntcUO-o.png)
./
pp_drawsphericalpoly.pro
Author information
- Author
Paulo Penteado (http://www.ppenteado.net), Aug/2015
Routines
top source pp_drawsphericalpoly
pp_drawsphericalpoly, ilons, ilats, icolors [, _ref_extra=_ref_extra] [, rgb_table=rgb_table] [, cg=cg] [, graphics=graphics] [, itool=itool] [, direct=direct] [, maxlength=maxlength] [, nsegments=nsegments] [, polygon=polygon] [, x=x] [, y=y] [, connectivity=connectivity] [, fill=fill] [, stackmap=stackmap], original_image=original_image [, maxstack=maxstack], stacklist=stacklist [, stackcount=stackcount] [, verbose=verbose] [, do_stack=do_stack] [, weights=weights] [, stackweights=stackweights] [, stackindex=stackindex] [, pcount=pcount], no_fix_lon=no_fix_lon, map_structure=map_structure [, image_mapstr=image_mapstr] [, xsize=xsize] [, ysize=ysize] [, e_map=e_map], bmin=bmin, bmax=bmax, bnan=bnan, btop=btop
Draws polygons on a map, with the polygon sides resampled to a large number
of vertices, so that the result resembles a spherical polygon (a polygon where
the sides are great circle arcs). Polygons can be drawn on Coyote Graphics,
iTools, Function Graphics or Direct Graphics. Se examples below.
Makes use of pp_sphericalpath to calculate the polygonal approximation to
the spherical polygon.
Parameters
- ilons in required
An array of longitudes for the vertices which are to be connected by a path made of great circles. Must be in degrees. Multiple polygons are supported in two different ways: 1) If all N polygons have the same number of vertices (M), lons can be given as a [M,N] array. 2) For arbitrary numbers of vertices, lons is given as a list, where each list element is an array of vertices for one polygon.
- ilats in required
An array of latitudes for the vertices which are to be connected by a path made of great circles. Must be in degrees. Multiple polygons are supported in two different ways: 1) If all N polygons have the same number of vertices (M), lats can be given as a [M,N] array. 2) For arbitrary numbers of vertices, lons is given as a list, where each list element is an array of vertices for one polygon.
- icolors in required
An array with the color to be used to draw/fill the polygons. If
rgb_tableis not given, this array is assumed to contain the colors in the system used by the kind of plotting selected: either a [3,M] array of color triplets, one triple per each of the M polygons, or a long integer array, with one long-integer-coded color for each of the M polygons. Ifrgb_tableis given, then colors can be an array of any numerical type, and the polygon colors will be determined by mapping the values incolorsto values in the 256-value colortable specified byrgb_table.
Keywords
- _ref_extra in out optional
Any extra arguments are passed to the polygon plotting routine: cgpolygon if
cgis selected, ipolygon ifitoolis selected, polygon() ifgraphicsis selected, or polyfill, ifdirectis selected.- rgb_table in optional
The color table to be used to map intensities into colors. This can be either a scalar, which will be used to select one of IDL's predefined colortables (0 is grayscale), or a [3,256] array of color triples, or a 256-element array of long integers.
- cg in optional default=0
If set, plotting is made with Coyote Graphics' cgpolygon.
- graphics in optional default=1
If set, plotting is made with IDL's Function Graphics' polygon().
- itool in optional default=0
If set, plotting is made with IDL's iTools' ipolygon.
- direct in optional default=0
If set, plotting is made with IDL's Direct Graphics' polyfill.
- maxlength in optional
Passed on to
pp_sphericalpath, determines the maximum length of the polygon sides used for plotting, in degrees.- nsegments in optional
Passed on to
pp_sphericalpath, determines the number of segments to use for the polygon sides.- polygon out optional
If Function Graphics or iTools are being used for plotting, returns the polygon object created with them.
- x out optional
If Function Graphics or iTools are being used for plotting, arrays of x and y points get created, one for each vertex of all polygons plotted. This keyword returns the x coordinates of the vertices created.
- y out optional
If Function Graphics or iTools are being used for plotting, arrays of x and y points get created, one for each vertex of all polygons plotted. This keyword returns the y coordinates of the vertices created.
- connectivity out optional
If Function Graphics or iTools are being used for plotting, arrays of x and y points get created, one for each vertex of all polygons plotted. This keyword returns the connectivity array which specifies which vertices belong to each polygon. See IDL's help on polygon() for more details.
- fill in optional default=0.
If Coyote Graphics' cgpolygon is being used, this keyword determines if the polygons are drawn just as outlines, or should be filled (outlines and fills share the same colors).
- stackmap out optional
if
do_stackis turned on, this argument returns the stacked map generated. If the algorithm selected isdo_stack=1, this will be an array of dimensions [maxstack,xsize,ysize], where [xsize,ysize] are the dimensions of the map created, andmaxstackspecifies the maximum number layers the map stack can have. At a given location [x,y] in the map, the values stackmap[*,x,y] are all the values present inicolorsthat fell onto that location on the map. The argumentstackcountis often useful, as it records how many layers were stacked at each location in the map. This will probably be more clearly explained by the examples below.- original_image
- maxstack in optional
Specifies the first dimension of the
stackmaparray, which is the maximum number of layers being tracked falling on each location on the map. If not set, it defaults to the number of polygons provided inilons,ilats,icolors. If there are many polygons, it is probably wise to specify a smaller value for maxstack, to avoid using too much memory. Usestackcountto check that at no location in the map there were polygons missed because that location had more overlapping layers than could fit intostackmap: ifstackcountis everywhere smaller than or equal tomaxstack, no polygons were lost instackmap.- stacklist
- stackcount out optional
if
do_stackis turned on, this argument returns the count of stacked layers in thestackmapgenerated. At a given location [x,y] in the map, stackcount[x,y] is the number of polygons that fell on that map location (the number of layers instackmapat that location). This will probably be more clearly explained by the examples below.- verbose in optional
- do_stack in optional default=0
If set to 1, instead of drawing the polygons on the graphics device, a z-buffer will be used to draw polygons in an invisible direct graphics window, which are used to generate a map of where each polygon falls (
stackmap). This will probably be more clearly explained by the examples below. Note that setting do_stack to a value higher than 1 is not the same as setting it to 1: other values turn on alternative stack algorithms, which at this time are still experimental and thus not yet documented.- weights in optional
- stackweights out optional
- stackindex out optional
If
do_stackis turned on, this argument returns the an array similar tostackmap, but its values are the indices to of the polygons that fall on each location, instead of being the intensities (icolors).- pcount out optional
If
do_stackis turned on, this argument returns the an array with the number of map pixels covered by each polygon.- no_fix_lon
- map_structure
- image_mapstr out optional
If
do_stackis set to 1, this argument will return the map structure created by map_set, which is used to define the map projection used to makestackmap.- xsize in optional default=640
If
do_stackis set to 1, this specifies the width of the map to generate (seestackmap).- ysize in optional default=480
If
do_stackis set to 1, this specifies the height of the map to generate (seestackmap).- e_map in optional
If
do_stackis set to 1, set this argument to a structure containing any parameters to be passed to map_set, which is used to define the map projection used to makestackmap. This will probably be more clearly explained by the examples below.- bmin
- bmax
- bnan
- btop
Examples
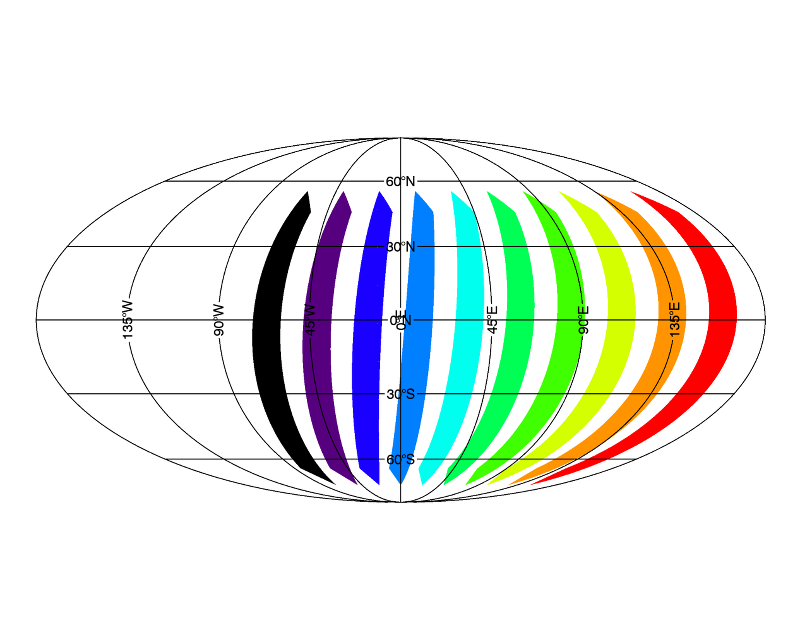
First, let's create some data to plot:
 ;create several rectangles
 lons=dblarr(4,10)
 for i=0,9 do lons[*,i]=[-85d0,-65d0,-55d0,-75d0]+i*25d0
 lats=dblarr(4,10)
 for i=0,9 do lats[*,i]=[-65d0,55d0,45d0,-75d0]
 ;set their colors
colors=dindgen(10) m=map('mollweide')
pp_drawsphericalpoly,lons,lats,colors,rgb_table=13,linestyle='none'
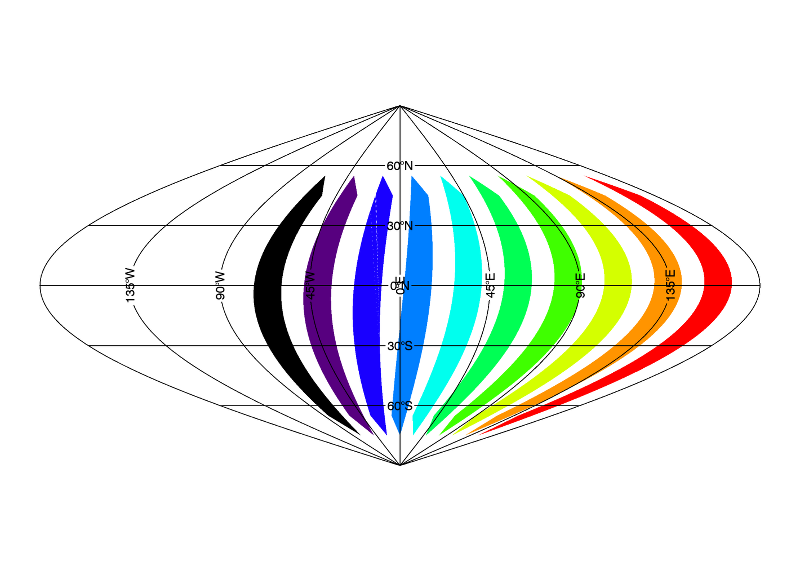
Plot the rectangles on an imap:
 imap,map_projection='sinusoidal'
 pp_drawsphericalpoly,lons,lats,colors,rgb_table=13,linestyle='none',/itool
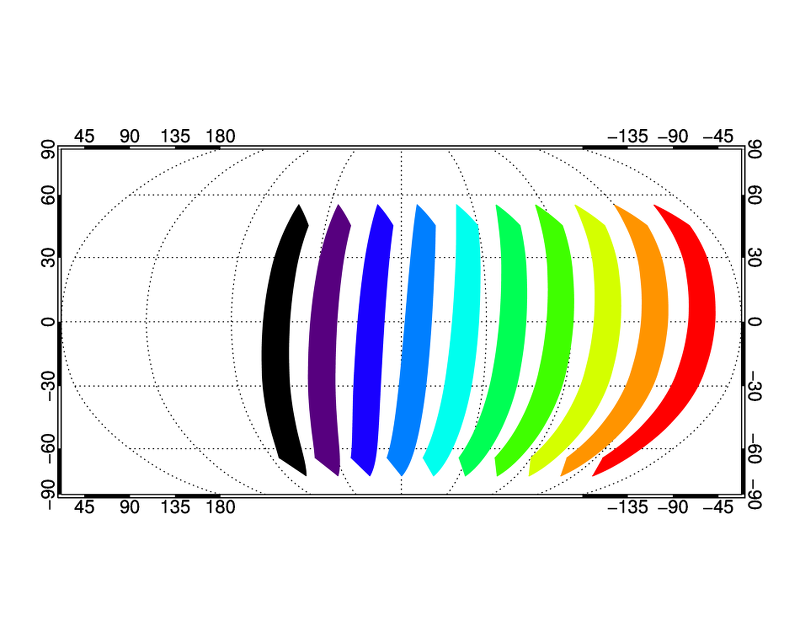
Plot the rectangles on a Coyote Graphics map:
 m=cgmap('robinson',/erase,/isotropic,/window)
 cgmap_grid,map=m,/box,/addcmd
 cgloadct,13
 pp_drawsphericalpoly,lons,lats,bytscl(colors),/cg,/fill,map=m,/addcmd
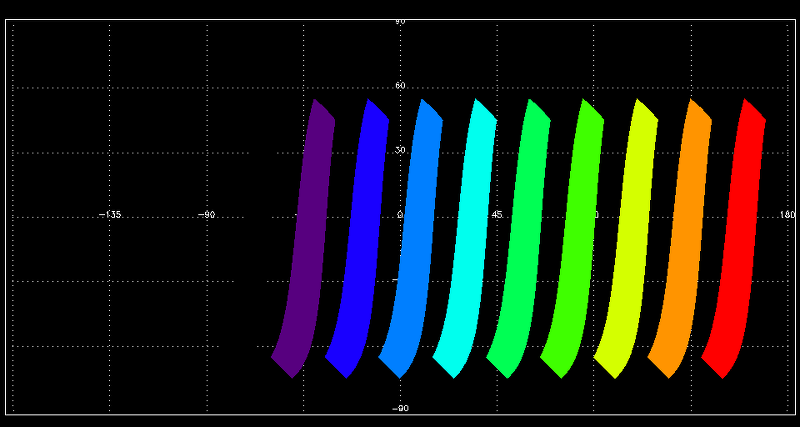
Plot the rectangles on a Direct Graphics map:
 map_set,0d0,0d0,/cylindrical,/isotropic,/grid,/label
 pp_drawsphericalpoly,lons,lats,colors,rgb_table=13,/direct
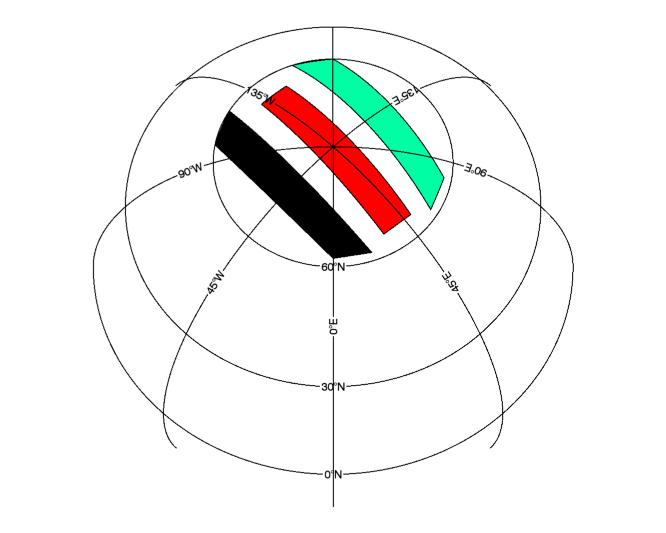
Now, let's make some data that spans the tricky region around the pole:
 ;make up the coordinates for the coordinates of 3 rectangular fields of view near the north pole:
 lons=[[20d0,240d0,260d0,0d0],[80d0,180d0,200d0,60d0],[50d0,210d0,230d0,30d0]]
 lats=[[62d0,60d0,60d0,62d0],[62d0,60d0,60d0,62d0],[65d0,67d0,67d0,65d0]]
 ;make up some pixel values to determine the color used to fill the 3 rectangles
 pixvals=dindgen(3)
imap,map_proj='orthographic',center_lat=60d0
pp_drawsphericalpoly,lons,lats,pixvals,rgb_table=13,/itool
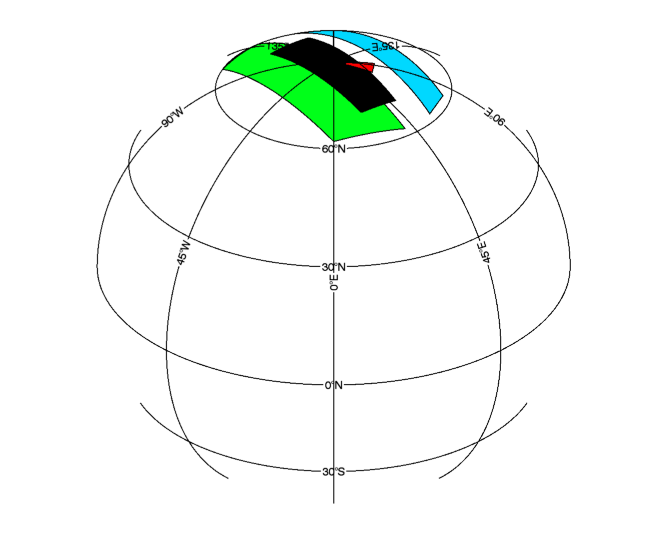
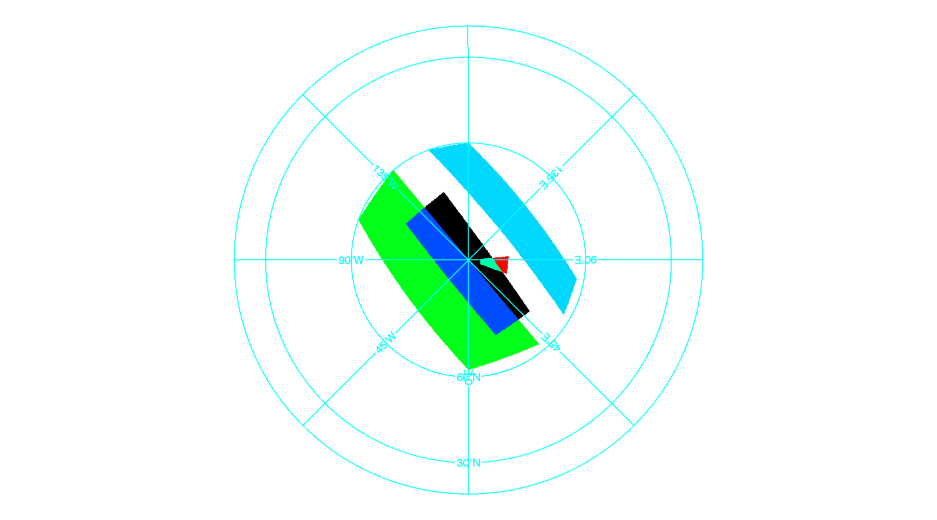
Now, an example with overlapping polygons, making an overlap map and taking the mean of the values on overlap:
 lats=[[62d0,60d0,60d0,62d0],[62d0,60d0,60d0,62d0],[70d0,72d0,72d0,70d0],[80d0,87d0,87d0,80d0]]
 lons=[[40d0,220d0,250d0,0d0],[80d0,180d0,200d0,60d0],[50d0,200d0,240d0,20d0],[70d0,70d0,95d0,95d0]]
 pixvals=[0d0,-1d0,-3d0,2d0]
m=map('orthographic',center_lat=30d0)
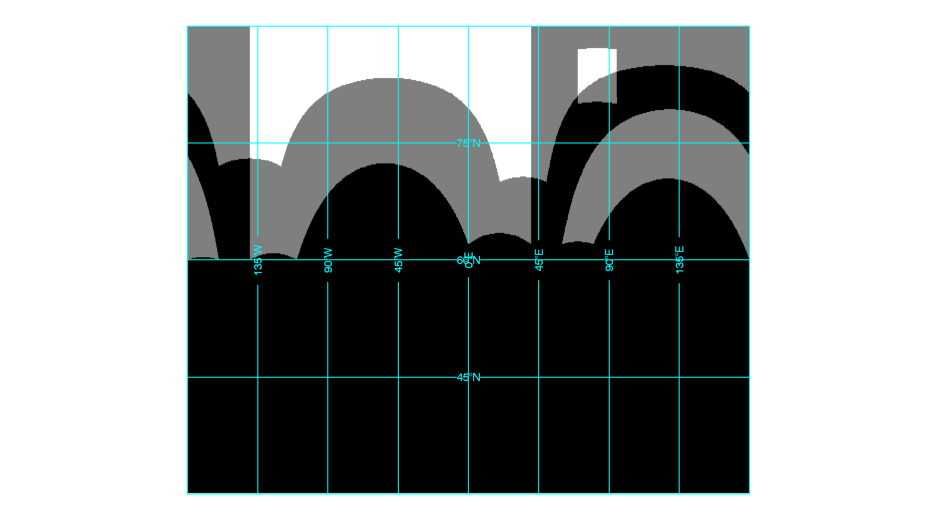
Now, make the stack map:
 pp_drawsphericalpoly,lons,lats,pixvals,rgb_table=13
 limit=[-90,-180,90,180]
 e_map={cylindrical:1,noborder:1,xmargin:0,ymargin:0,limit:limit,isotropic:1}
 pp_drawsphericalpoly,lons,lats,pixvals,do_stack=1,stackc=stackc,e_map=e_map,xsize=3000,ysize=1500,maxstack=4,stackm=stackm
 im0=image(stackc,map_projection='equirectangular',grid_units=2,image_location=limit[[1,0]],image_dimensions=[limit[3]-limit[1],limit[2]-limit[0]],dimensions=[900,500],color='cyan',aspect_ratio=5.,limit=[30,-180,90,180])
 im1=image(stackc,map_projection='orthographic',center_lat=30,grid_units=2,image_location=limit[[1,0]],image_dimensions=[limit[3]-limit[1],limit[2]-limit[0]],,dimensions=[900,500],color='cyan',rgb_table=13)
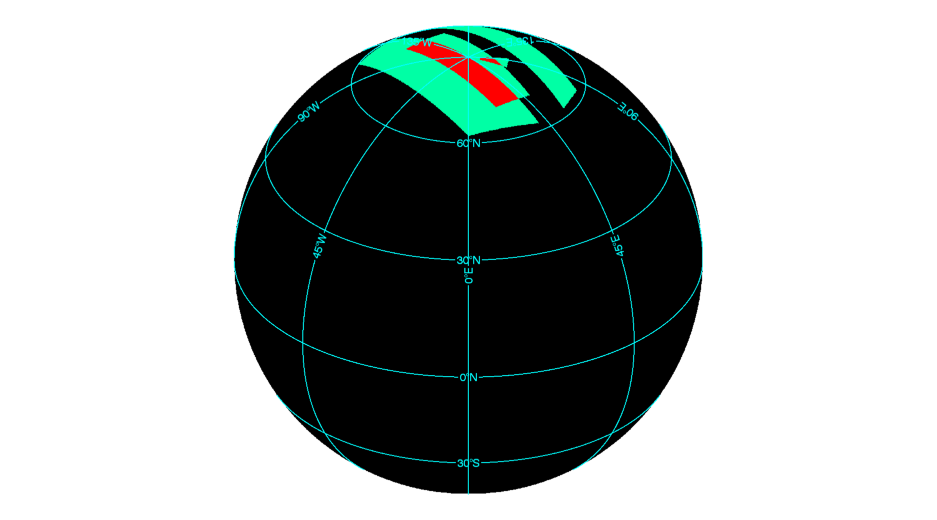
Make an average image from stackm, by taking then mean over the stack (first) dimension:
 stackmean=mean(stackm,dimension=1,/nan)
 im2=image(stackmean,map_projection='orthographic',center_lat=90,grid_units=2,image_location=limit[[1,0]],image_dimensions=[limit[3]-limit[1],limit[2]-limit[0]],dimensions=[900,500],color='cyan',rgb_table=13)
Author information
- Author:
Paulo Penteado (http://www.ppenteado.net), Aug/2015
Other attributes
- Requires:
If Coyote Graphics are to be used, the Coyote Library needs to be installed.
Also needed are
pp_sphericalpath,pp_longtocolortriple,pp_colortripletolong, andtessellateshapes_pp, from pp_lib).
Statistics
| Lines: | 94 lines |
| Cyclomatic complexity: | 22 |
| Modified cyclomatic complexity: | 18 |
File attributes
| Modification date: | Wed Mar 7 17:08:26 2018 |
| Lines: | 276 |
| Docformat: | rst rst |